Journey Engine: where people leave, and why
At Playfull, our sign-up data lived in four places and nobody could see the whole journey. I designed a map that puts funnels and session replays side by side, shows where people leave and why, and admits which steps we can’t measure yet. It’s an internal tool, still in development.
Sign-up data was spread across four tools, and our AI agents were writing daily reports from numbers nobody had checked.
Designed the concept, the data model and the interface of a map that shows each step of sign-up: who arrives, who leaves, and why.
The first run on real data changed how the team read its own numbers, and turned the tracking gaps into tickets.
Context
Playfull is a game discovery platform. New people arrive mostly on mobile, from short video ads, and go through a sign-up flow before they reach the product.
I started with three questions. Where do people leave the sign-up flow? Why? And can we trust what the dashboards say?
Every screen on this page uses fictional sample data. No real Playfull numbers appear here.
The problem
The numbers were in one tool, but the reasons were not. A funnel says that people left, not why.
Session replays showed the why, one session at a time. Nobody had time to watch enough of them to see a pattern.
AI agents were already writing daily reports, but nothing checked their claims against the data or told a fact from a guess.
Process
Start from what’s actually recorded
Before connecting any data, I mapped the sign-up flow screen by screen and asked one question: what gets recorded here, and what doesn’t?
I found eight places where nothing was recorded at all. That shaped the whole tool: a step without data has to look different from a step where nobody left.
One format, many views
I designed the shape of the data before the interface. Every source writes the same format, and the map only reads it.
Each insight needs four parts: what was seen, the evidence behind it, a guess labelled as a guess, and the number to watch. An insight without evidence doesn’t count.
Fake data, clearly labelled
While access to the data was pending, I built the map with fictional numbers, labelled as fictional on every screen. It let me test how the tool works before real numbers could bias the design.
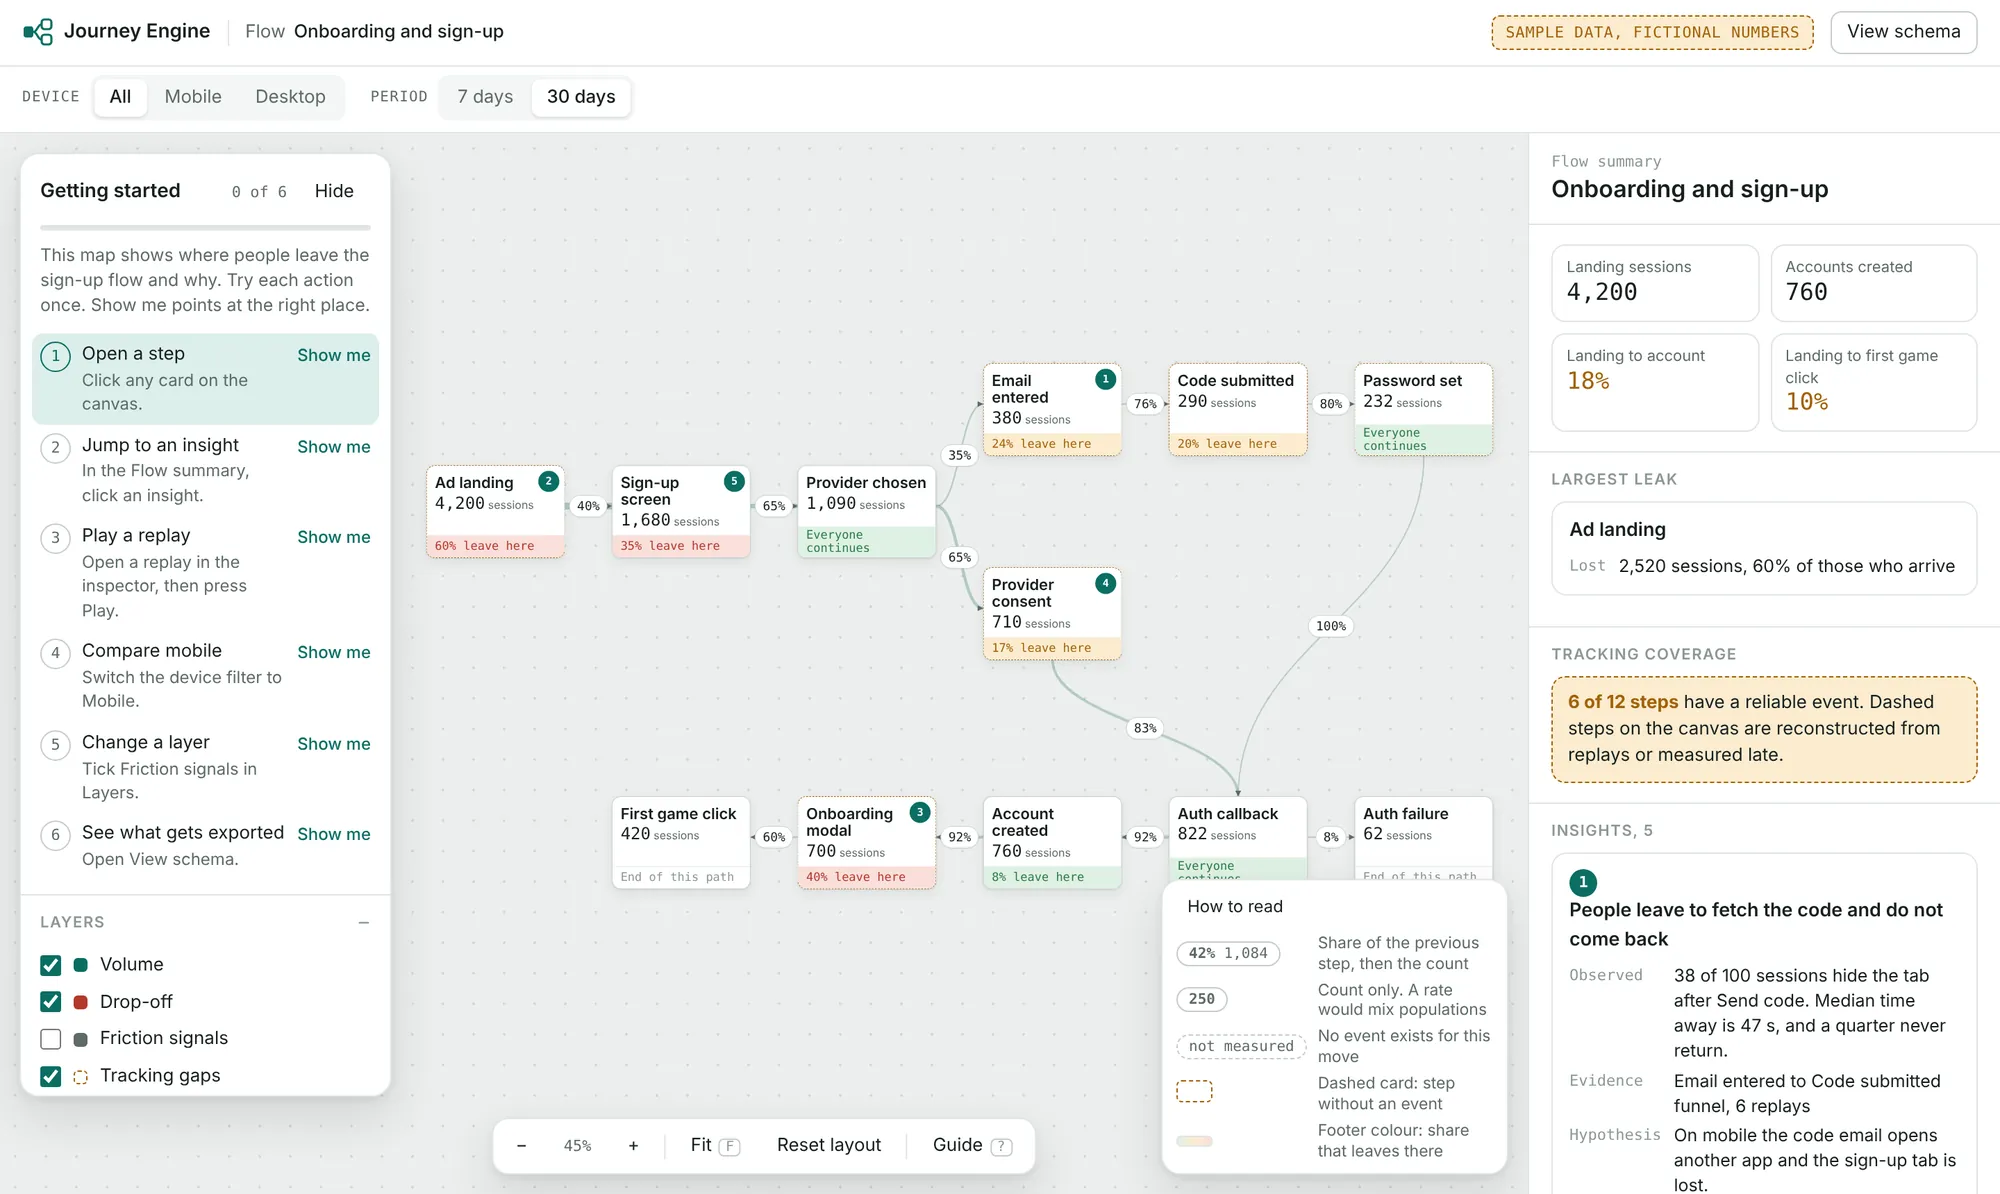
The map opens on the whole flow. Dashed steps have no event, so they read as not measured instead of zero. Fictional data.
Overview first, details on click
Following Shneiderman’s rule for information tools, the map opens on the whole flow, coloured by how many people leave each step. Clicking a step opens its numbers, insights and replays on the side.
A session replay plays back as a list of pages, clicks and signals, step by step on the map. The tool never needs to look at the screen itself.
There’s no upfront tour, because Nielsen Norman Group’s research shows people skip them. Instead, a short checklist of real actions, each with a Show me button that points at the right control.
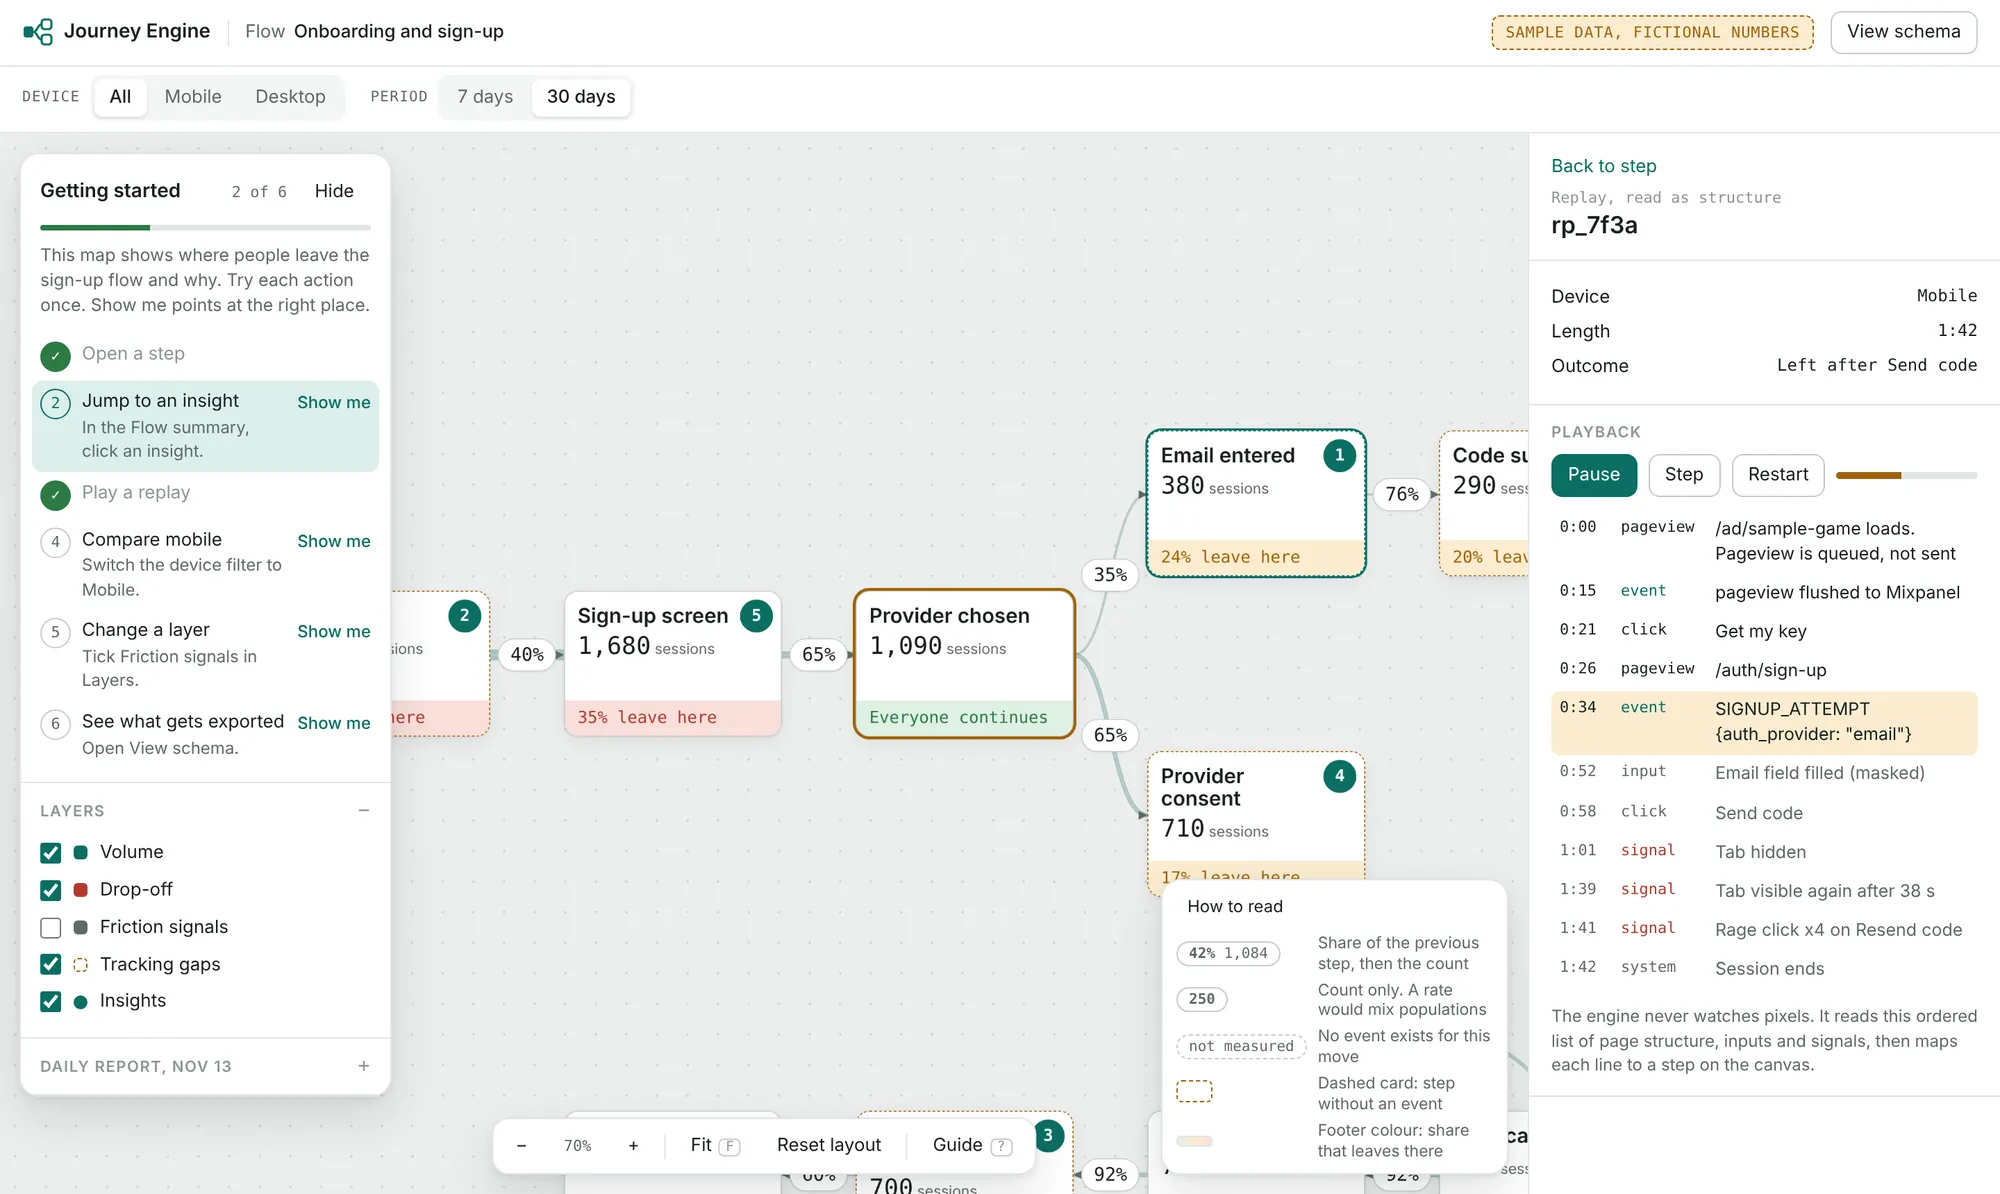
A replay read as structure: pages, clicks and signals, matched to steps on the map. Fictional data.
Rules for the AI agents
AI agents can read a journey and write findings, with rules. They separate what they saw from what they guess, cite only numbers that exist, and point to the evidence.
Every new finding starts as proposed. Only a person can confirm it or reject it.
Check the first reading
When real data came in, I reviewed the agents’ analysis against it instead of accepting it. The numbers were right, but several conclusions changed once I looked at what the events actually meant.
Each correction went into the tool as a proposed insight with its evidence, and into a short report for the team.
Test it as a first-time user
Before calling it done, I went through every screen as a new user would and asked one question: could someone make a wrong decision here without clicking anything?
That led to labelled filters, a How to read legend, clear messages when a query fails, and a warning when a group’s numbers can’t be trusted.
Decisions
A missing event and a real drop-off look the same as a number. They lead to opposite actions.
AI reports are cheap to write and hard to check. Asking for evidence makes them checkable.
The agents got the numbers right and some conclusions wrong. That’s why nothing they write is final.
The map stays the same when the data source changes.
If many people in a group came for a reward, the tool says its numbers don’t show real interest.
The tool keeps what a replay shows about the flow, not the person’s data.
Outcome
The first run on real data changed how the team read its own numbers. A few conclusions we had taken for granted didn’t survive a look at what the events actually contained.
The eight tracking gaps became engineering tickets. Linking the task board to each step made it easy to spot work marked Done next to a step whose numbers never moved. And people outside the data team can now ask questions about the journey without building a funnel in Mixpanel.
I’m not sharing figures from this project.
Takeaway
Most of the usability problems I found had nothing to do with layout. They were about trust: is this number real, what does it count, and what does it leave out?
“Completed a step” looked like activation until I watched what people did right after it, and asked whether they’d have done it without a reward.
AI gave me a fast first read of the data. It became useful the moment I made its output easy to check, and risky whenever it sounded like a conclusion.
If I did it again, I’d settle the data format even earlier. Every screen got simpler once it was clear.